
Share this tool:
Description:
Flowpoint AI is a website analytics platform for marketing teams that want cleaner reporting, faster dashboard creation, and more direct insight into how visitors behave on a site. Its newer positioning leans into agentic analytics: install a tracking script, describe what you want to see in plain English, and let the AI build interactive dashboards, charts, funnels, and reports without needing SQL or engineering support.
Flowpoint’s strongest idea is simple: it tries to reduce the distance between “I need to understand this website problem” and “I have a usable dashboard or report.”
Traditional analytics tools can be rich but awkward. You often need to know where the right report lives, how events are named, how funnels are built, and how to turn the data into something a stakeholder can understand. Flowpoint moves that process closer to a conversation. Its agentic version lets users describe dashboards in plain English, then generates interactive dashboards with charts, tables, metrics, funnels, and filters.
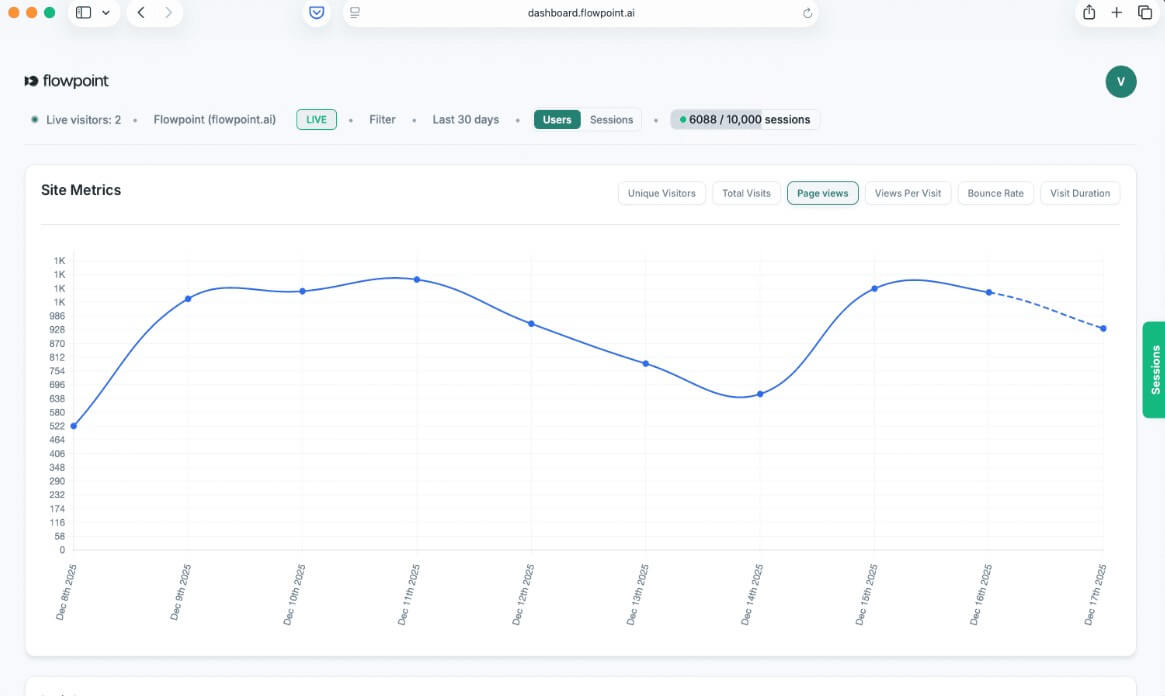
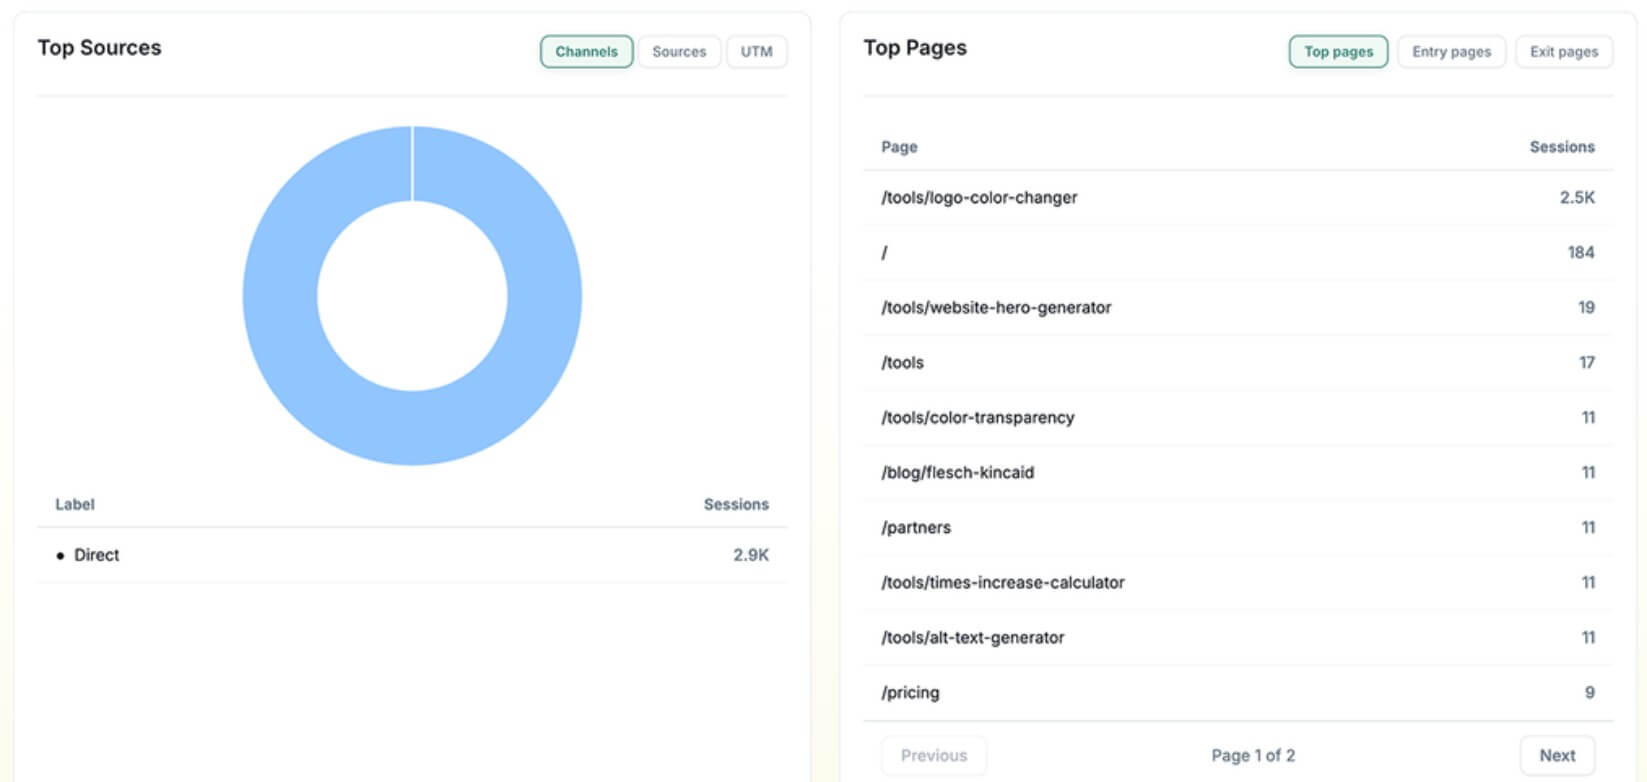
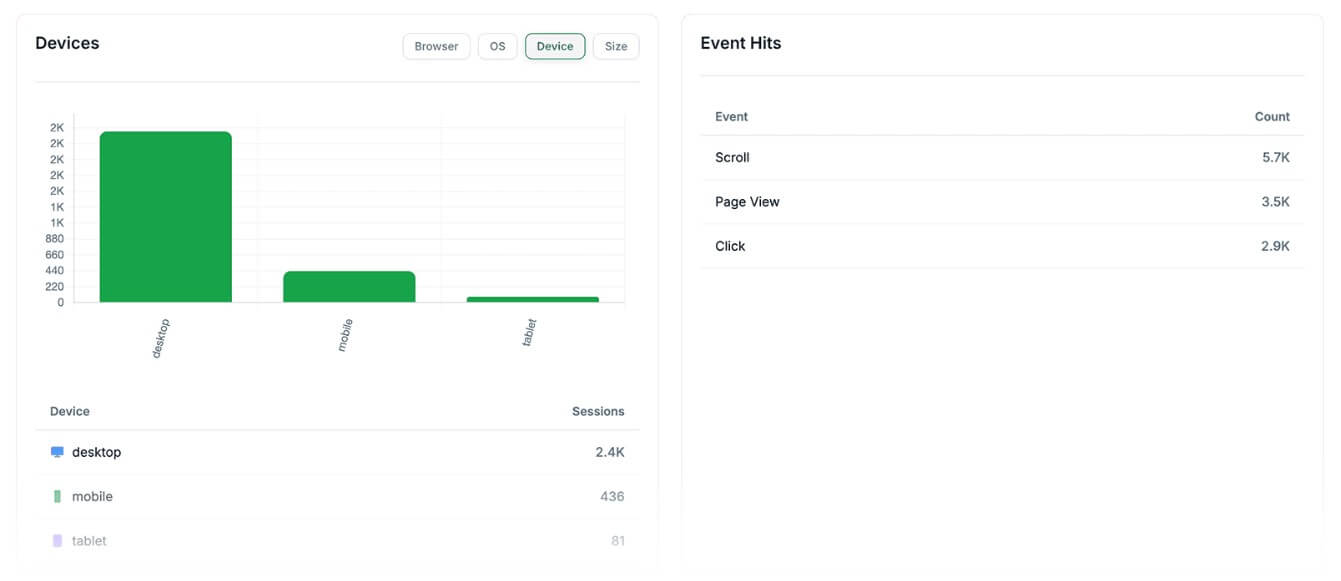
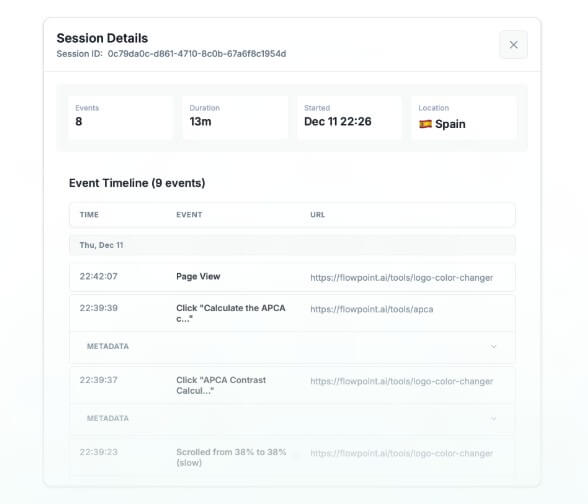
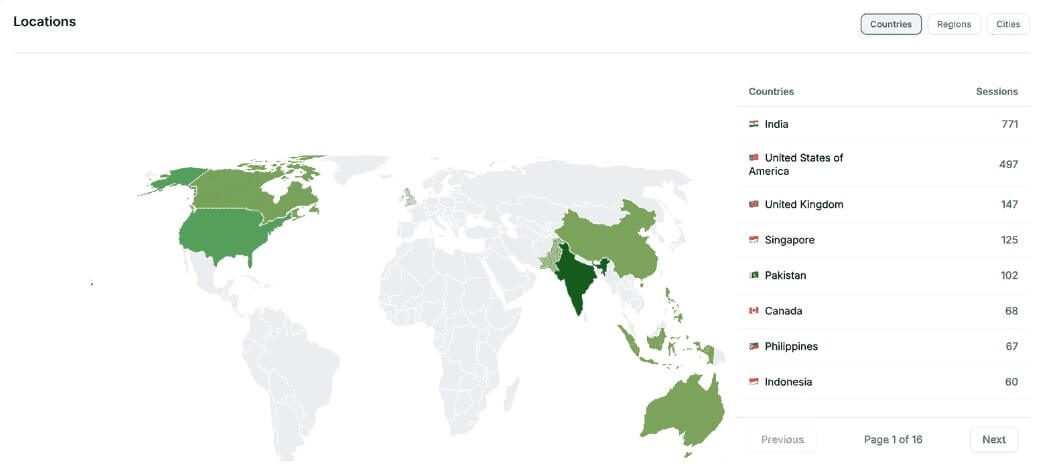
That makes it a good fit for teams that ask practical marketing questions every week: Where are signups dropping? Which source is driving qualified traffic? Which pages are attracting visitors but not converting? Which campaign needs attention? Flowpoint’s public site also highlights everyday analytics views such as top sources, top pages, events, sessions, and event timelines, which keeps the product grounded in normal website performance work rather than abstract AI features.

The workflow is built around speed. Flowpoint’s agentic site presents the setup in three parts: install a lightweight script, chat with the AI agent to create dashboards, then share dashboards or reports with the team. It says the script works with common site frameworks and platforms, including React, Next.js, WordPress, and Webflow.
The best part of this workflow is that it removes some of the friction that slows down marketing reporting. A marketer should not always need an analyst to answer a basic funnel question. A founder should not need to rebuild a dashboard from scratch every time a campaign changes. A content team should not have to dig through five analytics menus to find page-level traffic and conversion data.
Flowpoint is not just a chat box over analytics, though. Its usefulness depends on whether the generated dashboards are clear, accurate, and easy to refine. The ability to iterate by chatting back and forth matters here. A first dashboard might answer the broad question, while a follow-up can narrow the view by source, country, device, campaign, or funnel step.
Flowpoint’s output is not a creative asset like an image or video. The output is a dashboard, chart, funnel, written insight, or report. That means quality should be judged by clarity, metric accuracy, filtering control, and whether the dashboard answers the actual business question.
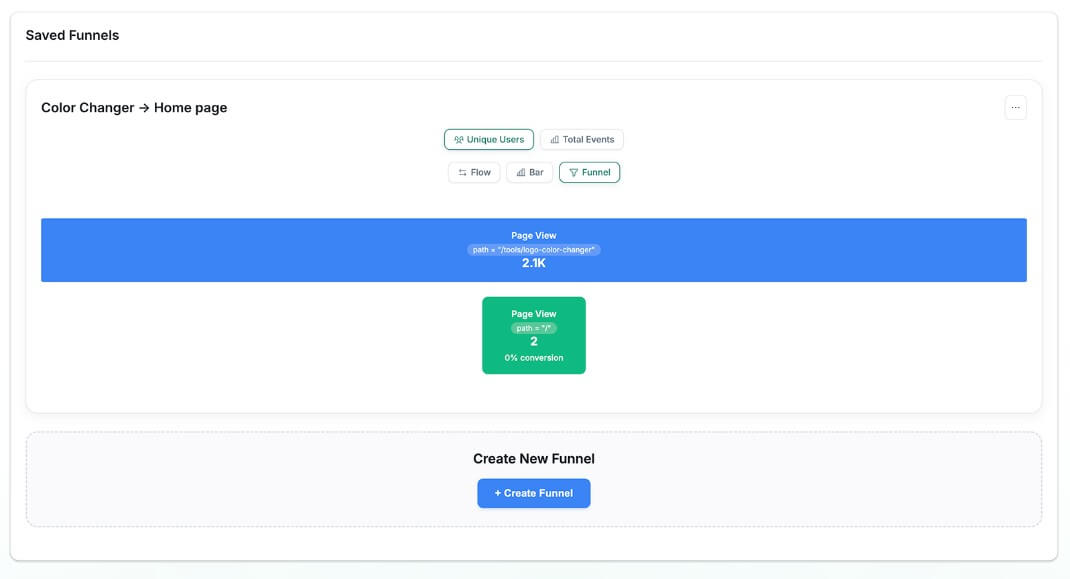
The platform appears strongest when the user knows the question but does not want to manually build the view. For example, “show me traffic by UTM source for the last week” is the kind of request that fits Flowpoint well. So is “build a funnel from homepage visit to signup” or “create a stakeholder report for campaign performance.” Flowpoint’s current site specifically describes real-time dashboards, funnels, filters, PDF exports, and live sharing, which are practical reporting features rather than decorative AI extras.
The main control issue is verification. Flowpoint’s own terms say users are responsible for reviewing and verifying AI-generated dashboards, reports, and visualizations before relying on them for business decisions. They also state that AI-generated outputs may contain errors or misinterpretations. That is the right caveat for this category. AI can speed up dashboard building, but it does not remove the need to check metric definitions, date ranges, filters, and event logic.
Flowpoint puts a lot of emphasis on privacy. Its agentic page says the AI creates the dashboard interface and layout, while the actual analytics data is fetched separately and does not pass through the AI model. It also says the platform is GDPR compliant and that users own their data, with export and deletion controls.
That architecture is important. Analytics data can include sensitive business information, campaign performance, visitor behavior, and conversion patterns. A platform that uses AI for dashboard generation needs a clean boundary between “AI helps build the view” and “AI reads all the underlying data.” Flowpoint’s stated approach is to have the language model generate the interface while keeping raw analytics data out of the model.
There is still one thing users should notice: Flowpoint’s terms say chat interactions and prompts submitted through AI dashboard creation may be processed by third-party AI providers, including Anthropic. Flowpoint also says it does not share raw analytics data with those providers. For most marketing teams, that separation will be the key point to review before adoption.
- Marketing performance dashboards: Flowpoint is a strong fit for teams that need quick views of traffic, sources, campaigns, pages, and conversions without building every report manually.
- Conversion funnel analysis: The funnel and filtering tools make sense for signup flows, demo requests, checkout paths, lead magnets, onboarding paths, and campaign landing pages.
- Stakeholder reporting: PDF export and live dashboard sharing help teams turn analytics into reports that clients, managers, or founders can review without needing full platform access.
- Small marketing teams without analysts: Flowpoint is useful when the person asking the question is also the person building the report. The AI dashboard workflow can reduce the need for technical setup.
- Campaign diagnosis: Because Flowpoint supports UTM reporting, source analysis, funnels, sessions, and event timelines, it is well suited to checking why a campaign is getting traffic but not producing enough action.
- Flowpoint still depends on good tracking setup: If events are poorly named, funnels are not planned, or conversion actions are unclear, the AI can only do so much. A clean dashboard does not fix weak analytics hygiene.
- The second limitation is trust: AI-generated dashboards can misread a request, choose the wrong metric, or produce a view that looks polished but answers the wrong question. Flowpoint acknowledges that users should verify AI-generated outputs before using them for decisions.
- Flowpoint also may not replace a full business intelligence stack for larger companies: Larger teams with complex data warehouses, offline revenue data, attribution models, and custom governance needs may still need a deeper BI setup. Its sweet spot is website intelligence and marketing analytics, not every kind of company data analysis.
- Start with one clear business question. “Why are demo requests down?” is better than “analyze my website.” Then refine by source, page, device, date range, and funnel step.
- Check the generated dashboard before sharing it. Confirm the date range, metric definitions, funnel order, and filters. This is especially important for stakeholder reports.
- Use Flowpoint for recurring reporting. If your team reviews campaign performance every Monday, build a dashboard once, then refine it as your questions change.
- Pair AI dashboards with human judgment. Flowpoint can surface the view, but the team still needs to decide whether the issue is traffic quality, page messaging, UX friction, tracking setup, or offer fit.
Flowpoint AI is best for marketing teams that want faster website analytics, cleaner dashboards, and easier funnel reporting without constant help from engineering or analytics specialists.
Its strongest value is not that it “uses AI,” but that the AI helps turn plain-English questions into usable dashboards and reports.
The main caveat is verification: teams still need to check the generated views, metric logic, and tracking setup before making business decisions from the output.
TAGS: Marketing
Related Tools:

AI-driven mapping for business networking

Simplifies the creation of high-converting pages

Combines AI and human expertise for multilingual content marketing
Generates posts for social media campaigns
Transforms product images into animated marketing videos

Enables artists to create high-quality animations